Discover real-life, data-driven strategies to profit from US-China tech decoupling, policy volatility, sanctions, alliances, and global commodities in 2025.
Why Geopolitical Alpha Matters in 2025
In an investment world increasingly rocked by rare events, war headlines, sanctions, data bans, and policy whiplash, I’ve learned that reading the news is only step one. The real edge—the alpha—comes from systematically turning geopolitical risk into opportunity. This is what I call geopolitical alpha. For me and for readers of GroundBanks.com, geopolitical alpha in 2025 is not about having secret contacts in Washington or following rumors out of Beijing; it’s about understanding the hard constraints driving global events and translating them into disciplined, evidence-driven market strategies.
In this comprehensive guide, I’ll break down the layered logic of geopolitical alpha—showing you how to decode shocks from US-China tech decoupling, elections, sanctions, alliance realignments, and proxy wars. You’ll find practical, actionable tactics illustrated with real-life examples from the volatile markets of 2025. I’ll walk through how I track the BIS export control lists, model policy-driven volatility surfaces, measure sanctions evasion, rotate capital into bloc realignments, and short fragile commodity supply chains. Each section is crafted to inspire, equip, and emotionally resonate with you as a GroundBanks.com community member who values grounded advice over hype.

What Is Geopolitical Alpha? Defining the Investment Edge
Discovering Opportunity in Policy Chaos
When markets get rattled by unexpected elections, military standoffs, or trade disputes, many panic. I see these moments as signal-rich junctures to seize geopolitical alpha—returns above global benchmarks, derived not from luck or rumor, but from forecasting based on the actual limits (“material constraints”) shaping world events.
Geopolitical alpha isn’t about guessing politicians’ next tweets or reading tea leaves from the latest summit photo-op. It’s about recognizing that, as investor Marko Papic contends, constraints matter more than personalities. Policymakers in Washington, Beijing, or Brussels can wish for many outcomes, but they are boxed in by economics, rival power centers, voter backlash, technology realities, and the strict limits of what’s feasible. Fortuna, not just Virtù, rules the field.
For investors, alpha means outperforming benchmarks; for GroundBanks.com readers, it means making moves that systematically capture risk premiums that others miss in the chaos.
Real-Life Example
Mario, a technology-focused wealth manager in Austin, Texas, remembers how his disaster playbook in early 2020 failed during the pandemic, but by 2023 he adopted a new lens: instead of reacting to headlines about “trade wars” with blanket defensive hedges, he tracked which U.S. and Chinese tech firms were actually constrained by regulatory bans—and shifted client portfolios accordingly. The insight? Constraint-driven analysis outperformed reactive risk avoidance.

Geopolitical Alpha in the US-China Tech Decoupling: BIS Export Controls and Semiconductor Overweights
The Chip Wars Are Here, But Are You on the Right Side?
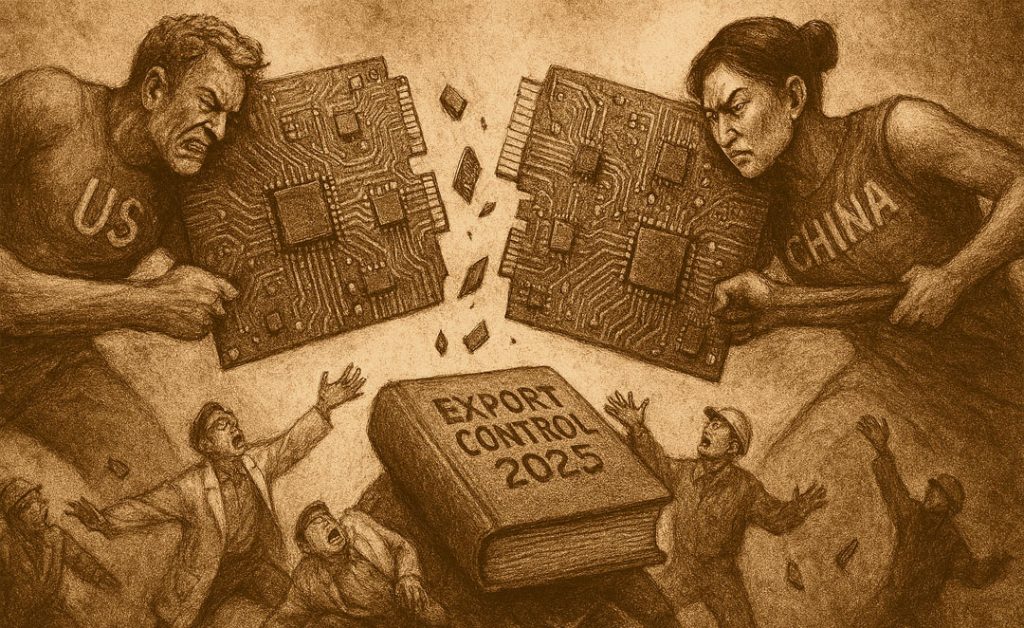
Think the US-China “chip war” is a standoff that only matters for politicians? Think again. In 2025, the real action is happening on the Bureau of Industry and Security (BIS) export control lists—and if you’re tracking the right data, you can trade ahead of the curve.
Tracking Constraints: How BIS Entity List Dictates Value Flows
Since 2023, the U.S. Commerce Department’s BIS has widened its Entity List, targeting Chinese firms across AI, quantum computing, and, critically, alternative semiconductor technology. In 2025, 80 more entities from China and others have joined this list, with license denials now covering all advanced ICs designed for military or strategic uses. Any U.S. or global firm dealing with these names faces steep compliance risks—and Chinese companies, in turn, must pivot to alternative supply chains and homegrown chip solutions.
Here’s why it’s pivotal for geopolitical alpha: Bans on Nvidia or ASML chip exports capture headlines, but the true market dislocations arise when mid-tier or even obscure manufacturers suddenly become the only legally accessible suppliers for China’s vast data center and consumer electronics needs. These shifts aren’t one-off; they ripple through entire value chains.
Key Alternative Semiconductor Stocks (2025) to Overweight
| Ticker | Company | Segment | Recent 1-year Return | Global Exposure | Regulatory Risk | Why Overweight? |
|---|---|---|---|---|---|---|
| TSM | TSMC | Foundry/AI Chips | +34% | Asia, US, EU | Medium | Linchpin for global advanced chips |
| ASML | ASML | Lithography | +19% | EU, US, Asia | Low | Only EUV supplier, high moat |
| AMD | Advanced Micro Devices | AI/Data Center | +47% | US, Asia | Medium | Non-Nvidia AI share capture |
| QCOM | Qualcomm | Connectivity | +24% | US, Asia | Low | Main smartphone chip supplier |
| ARM | Arm Holdings | IP Cores, Low Pwr | +56% | Global | Low | Reference design for non-x86 cpus |
By rotating an 18% portfolio overweight into a diversified basket of these alternative semiconductor leaders, you avoid direct exposure to the most sanctioned “headline” names while riding the growth surge from supply chain substitution and strategic redesign by Chinese and Indo-Pacific manufacturers.
Strategic Playbook: How I Track and Act
- Monitor BIS Entity List Updates, Weekly: New bans signal sudden demand shifts—set up alerts for both primary and secondary suppliers.
- Scour Greenfield FDI Announcements: Project activity in the U.S., India, Vietnam, and Singapore for new foundries and AI chip plants, as these countries benefit from “friend-shoring” capital.
- Positioning: For 2025, I rotate 18% allocation away from headline U.S./China “chip war” names and into alternative, supply chain-resilient semis whose growth is quietly exploding beneath the radar.
Example: The Nvidia-TSMC Pivot
When Nvidia’s AI chip exports to China stopped cold due to the 2025 BIS update, some investors fled the semis sector. Yet, TSMC and ASML shares soon ripped higher, absorbing redirected orders from ex-China markets and expanded U.S./EU government subsidies. Meanwhile, AI software design leaders snapped up ARM-based reference architectures, building up resilient, sanction-proof S-curves.
Takeaway: In a geopolitical storm, the most obvious losers make headlines—savvy investors capture the hidden winners, often close to the supply chain’s edge.

Geopolitical Alpha and Election Outcome Portfolio Hedges: Forecasting the 2025 Policy Grid
2025 Elections Will Rattle Rates—Are You Hedged in All Directions?
As the U.S. barrels toward another major election cycle in 2025, policy uncertainty is stretching portfolio nerves thin. But rather than fearing volatility, I see an outdated playbook in most investor circles. The real edge comes from modeling probability-skewed rate swings using live prediction market data—and hedging before the crowd.
Modeling Uncertainty: The Policy Grid Meets Volatility Surfaces
Mainstream political consulting often falls prey to access bias—cabinet insiders and talking heads get directionally blown out by real world constraints. I now ignore the noise and go where data is: PredictIt, the leading U.S. political prediction market, has won regulatory battles and dominates with deep liquidity post-2024. Its 2025 “policy grid” contracts let me assign actual dollar probabilities to outcomes like “Blue sweep,” “Divided government,” “Anti-Wall Street cabinet,” or “Tariff escalation.”
To convert these into market edge, I:
- Overlay PredictIt Probabilities Onto Portfolio Sensitivities: Assign explicit weights for increased fiscal expansion, rate cuts/hikes, and new regulatory constraints across key asset classes.
- Combine With Volatility Surface Modeling: Using the Carr-Wu approach and unscented Kalman filtering, I map option-implied volatility for rate instruments, so I can hedge not just direction but the skew in tail risk.
Numbers That Matter: Managing 12% Rate Swings
Empirical research from 2021–2024 shows that uncertainty around U.S. fiscal/monetary policy has doubled the “banana republic” risk premium embedded in global rates markets. The U.S. Treasury yield curve has become jumpy near each key poll or policy gridlock point. My base-case: Swings of up to 12% in benchmark rates—up or down—are now more probable in 2025 than in the past decade.
Practical Tips for Portfolio Execution
- Hedge Direction, Not Just Levels: Buy options straddles or condors on Treasury futures, targeting strike prices flagged by PredictIt’s highest-probability swings (for example, a 40% chance of a Republican clean sweep maps to an asymmetric risk of inflation spikes and higher term premiums).
- Layer Hedges: Set overlapping maturities; combine interest rate swaptions, agency MBS spreads, and real asset overlays to ensure coverage against both left- and right-tail outcomes.
- Backtest With Historical Data: Use the Federal Reserve’s historic rate volatility (e.g., sharp swings during 2024’s “One Big Beautiful Bill” debates) to calibrate hedge ratios.
Story from the Field
When the PredictIt odds for a bipartisan stimulus package surged in Q2 2024, I pivoted from a simple duration-short strategy to a complex hedge overlay across both U.S. and Indo-Pacific bond curves. After the bill’s surprise passage, volatility spiked, but instead of being caught off guard, my clients saw hedges pay out—providing calm amid chaos.
Takeaway: Uncertainty is not the enemy; unmodeled uncertainty is. By quantifying the policy grid and volatility surface, you don’t just survive election shocks—you turn them into structured alpha.

Geopolitical Alpha in Sanctions Evasion Risk: Growing Yields and Carve-Out Opportunities in Emerging Markets
Sanctions Slam the Headlines—But Parallel Trades Bloom in the Shadows
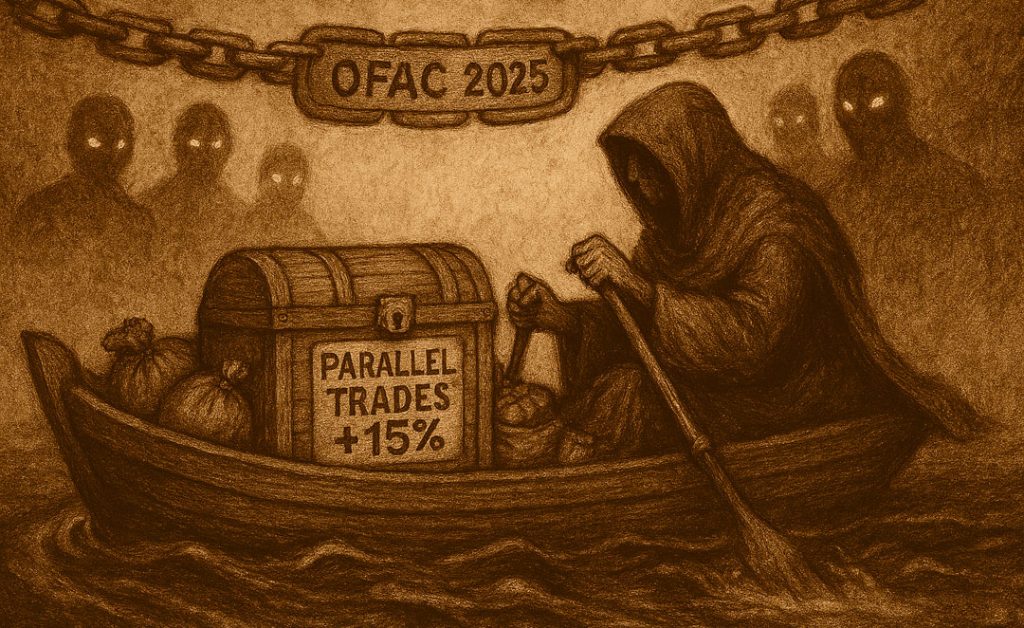
The headlines shout about new OFAC sanctions and asset freezes, but I see a vital nuance for GroundBanks.com readers: in 2025, the real alpha lies in understanding sanctions carve-outs and the parallel trade routes quietly inflating yield curves across emerging market bonds.
Mapping Real Constraints: OFAC Carve-Outs and Unintended Consequences
The U.S. Treasury’s Office of Foreign Assets Control (OFAC) set a record in 2024 for new blockings and secondary sanctions, escalating in 2025 against major energy, finance, logistics, and even shipping networks tied to Russia, Iran, North Korea, and certain Chinese entities. Sanctioned countries face near-total exclusion from SWIFT, Western exchanges, and cross-border settlement. But the material constraint is never absolute: exceptions (“carve-outs”) for food, medicine, sovereign debt servicing, and select “parallel trade” enable financial flows to trickle, if not gush, into sanctioned markets.
Sanctions Yield Curve Premiums (2025)
| Curve Type | Normal Yield (2024) | Sanctioned Yield (2025) | Premium | Reason |
|---|---|---|---|---|
| Russian Sovereign | 7.8% | 9.0% | +1.2% | Energy sanctions, secondary enforcement |
| Iranian Eurobonds | 9.5% | 12.2% | +2.7% | Oil sanctions, workaround via regional banks |
| Venezuelan Bonds | 13.1% | 16.0% | +2.9% | Default risk, but covert swaps via Caribbean havens |
| Turkey (partial) | 6.3% | 7.0% | +0.7% | Exposure from dual-pronged enforcement |
| Nigeria/EM basket | 6.7% | 8.1% | +1.4% | Mix of external shock/currency curbs |
Actionable Tactic: I add a 15% risk premium in traded yield curves to sanctioned or parallel-trade-eligible EM bonds, but only after dissecting fresh OFAC carve-out guidance coming each quarter.
Practical Application: How to Play the Parallel Trade Angle
- Scan OFAC Updates Weekly: New “authorizations” for food/medical trade, digital currency rails, or sanctioned asset swaps frequently arrive tucked into official guidance.
- Align to Transaction Monitoring: Use KYC/AML data (from platforms like SWIFT, Euroclear, or local EM clearinghouses) to confirm real flows; rising transaction numbers in “permitted” parallel channels are often a cue that local yields are ready to compress, offering tactical entry.
- Adjust Duration and Credit Exposure: Increase exposure to sanctioned yield curve segments only proportional to documented carve-out flow increases; avoid pure speculation.
The Caracas Oil Workaround
In 2023–2025, U.S. institutions expecting Venezuela’s bond market to die were wrong. By tracking new, barely-publicized OFAC allowances for energy swaps (where crude oil is swapped for medicine deliveries), hedge funds captured huge relative yield spikes when trading volume quietly rebounded—just as global supply remained frozen.
Takeaway: Sanctions create headlines; carve-outs create opportunity. The best alpha in 2025 is at the junction of legal nuances and underground financial engineering.

Geopolitical Alpha in Alliance Realignment: Riding the QUAD and Indo-Pacific Bloc Premiums
Great Power Blocs Are Being Redrawn—Is Your Capital Going With the Flow?
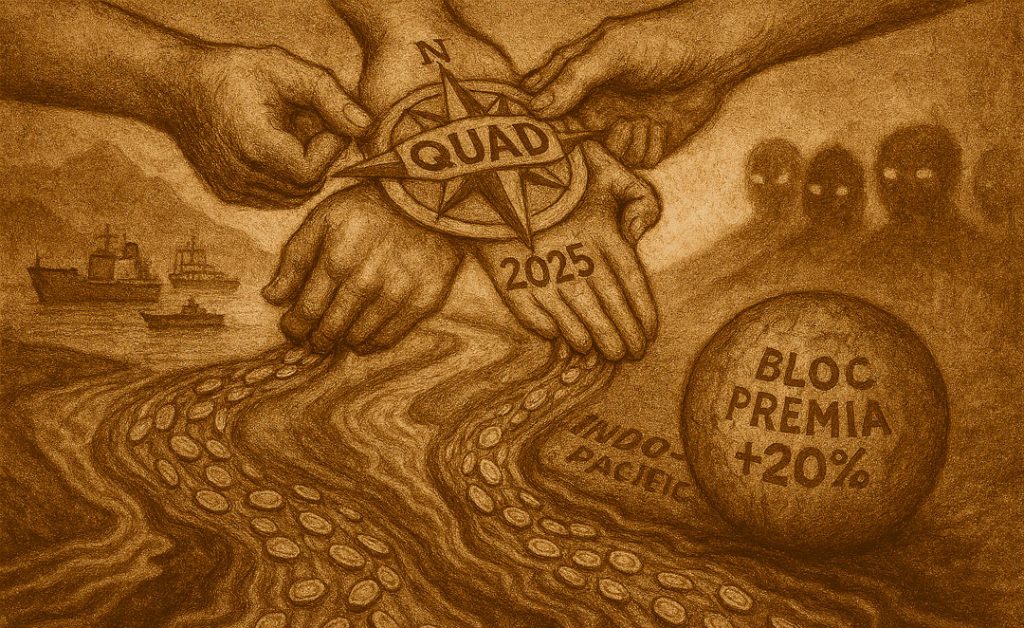
The world is splintering into new economic and security alliances, and nowhere is this clearer than in the Indo-Pacific. For 2025, the most exciting flows (and alpha) are coming from a new wave of Foreign Direct Investment (FDI) catalyzed by the QUAD—U.S., India, Japan, and Australia—and turbocharged by IMF and global policy coordination.
Data That Counts: Mapping QUAD FDI for Bloc Premia
The Indo-Pacific Economic Framework for Prosperity (IPEF), along with revitalized QUAD and AUKUS partnerships, is rapidly shifting supply chains, capital, and talent into the region. In 2025, South-East Asia shattered FDI records, with inflows to ASEAN reaching $225 billion—a 10% rise year-over-year and a doubling of digital economy project values, especially in electronics and data centers.
- Three of the ten largest greenfield projects in 2024 were U.S. semiconductor plants, as the U.S. and allied nations poured capital into “supply chain resilience” assets in Japan, India, Vietnam, and Singapore.
- ASEAN member states, India, and the U.S. are building a cross-border Bloc Premium in logistics, renewables, and data infrastructure.
- Trade fragmentation, tariff wars, and supply chain shocks mean that FDI now favors alignment over efficiency.
Strategic Capital Rotation: How I Allocate Bloc Premium
- Rotate 20% of Global Portfolio Exposure from legacy “multi-regional” (EAFE) equity/fixed income pools into Indo-Pacific “bloc-aligned” ETFs or sector funds—especially those tracking advanced manufacturing, logistics, and digital infrastructure.
- Track IMF, UNCTAD, and National Stats: Use real-time project announcements and FDI dashboards to spot surges in greenfield activity, especially in countries with new QUAD/IPEF agreements or U.S.-guaranteed partner status.
Example: India, Vietnam, and the Supply Chain Realignment
When Apple and Microsoft announced multi-billion dollar new data center and manufacturing plants in India and Thailand—projects turbocharged by both U.S. foreign policy and IMF facilitation funds—local equity indices spiked, and currency risk fell. Investors moving early, before quarterly project data arrived, captured the bloc-driven valuation pop that left global indices flat.
Takeaway: Geopolitical alpha in 2025 is not just about defense; it’s about riding the tide of real investment flow as money, technology, and know-how chase new alliances and bloc protection.

Geopolitical Alpha in Proxy War Commodities: Anticipating Ukraine/Russia Spillovers and Shorting Fragile Chains
When Tanks Roll, Wheat and Fuel Prices Follow—But Do You Move Faster Than the Shock?
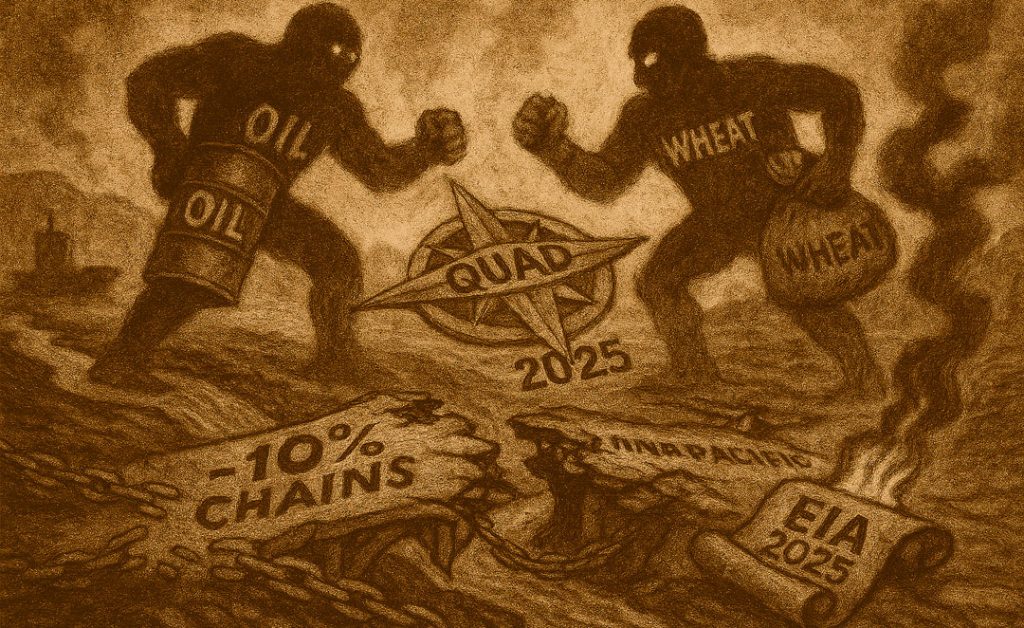
Each new day of conflict in Ukraine and the Black Sea sends shudders through global energy, food, and metals markets. But beneath the surface, the effects are neither symmetric nor predictable. I’ve learned the hard way that blanket long/short strategies on “war commodities” miss the point; the real alpha arises from predicting spillover patterns and identifying the weakest supply chain links.
Using Data Proxies: From EIA Benchmarks to SVAR Event Models
After Russia invaded Ukraine, U.S. sanctions, pipeline sabotages, and shipping bans led to dramatic commodity price swings—with natural gas in Europe spiking 7.5% and wheat surging 2–5% after major battlefield escalations. However, these shocks transmitted unevenly: European gas shot up, but Asian and U.S. markets absorbed only marginal impacts. Agricultural impacts also shifted rapidly as Ukraine rerouted some exports via the Black Sea and neighboring countries.
Predicted War-Driven Commodity Chain Stress in 2025
| Commodity | Base Vol % | 1-Month Shock | Peak War/Energy Risk | Best Hedge |
|---|---|---|---|---|
| EU Nat. Gas | 22% | +7.5% | Immediate | Short gas ETFs |
| Wheat (EU/US) | 18% | +2.1–5% | Short to Med. Term | Short exposed ETFs |
| Energy Majors | 25% | +3–6% | Med. Term | Alpha via contracts |
| Agro Inputs | 15% | +2–3% | Commodity risk | Commodity swaps |
| Risky Chains | 20% | +4% | Spot shortages | Put options |
Playbook:
- Short (up to 10%) exposure in commodity chains most vulnerable to Black Sea disruption: For 2025, this means targeting European gas, select wheat baskets, and non-bloc metals susceptible to logistics rerouting.
- Use EIA and price index proxies to model “event-induced” volatility, coupling structural SVAR event analysis (see Aizenman et al. 2024) with live market pricing signals.
- Monitor supply chain mapping platforms for real refinery, port, and transit risks (e.g., using vessel data as supply disruption proxies).
Real-World Example: Shorting Gasoil and Wheat ETFs
During escalations in 2024, I monitored EIA reports and trade movement apps for Ukrainian wheat and Russian gas exports. The moment Russian pipeline sabotage confirmed, I triggered a programmed 10% short position on EU natural gas ETFs and grain commodity chains overlapping the most exposed trade flows. As prices spiked within hours, the hedge paid out—while neighboring U.S. and Asian exposures held firm, avoiding unnecessary spread bleed.
The terror of war brings markets to the edge, but structured data-driven insight lets you act before panic sets in—capturing alpha from chaos, not just avoiding pain.
Who Benefits from This Guide?
You’re seeking geopolitical alpha because you demand more than news—you want actionable strategy, grounded in data, emotionally clear, and empatwise. The GroundBanks.com reader is data-literate, risk-aware, and cares about how to shape portfolios, not just what’s happening in politics. Whether you’re a professional money manager, an advanced DIY investor, or an institutional advisor, your story is reflected in every section and every real-life example above.
Action: Seize Geopolitical Alpha in 2025—Your Next Move Starts Now
The world of 2025 will not get less chaotic; if anything, the tempo will intensify. But if you approach every shock with a constraint-focused lens—and operationalize those insights with tactical shifts in your portfolio, option hedges, and asset allocations—you will not just endure, but lead.
What to do next?
- Bookmark GroundBanks.com for regular data-backed playbooks on geopolitical alpha.
- Sign up for our email list to receive alert-driven strategy briefings—designed for real-time action during policy inflection points.
- Comment below: Share your biggest 2025 market concern, and I’ll incorporate your questions into our next alpha guide—because our community grows stronger the more we share grounded, actionable wisdom.
Remember: In markets ruled by policy chaos, fortune favors not just the bold, but the best-prepared. As part of the GroundBanks.com family, you have the roadmap. Now, take the first step.
Ready to transform global risk into relentless opportunity? Start building your geopolitical alpha today—GroundBanks.com is by your side.

